Five Fun Facts About Multibeam Mapping

This blog was written by Science Communication Fellow Katie Doyle.
Maps are a critical part of our everyday life and a key to understanding our world. They provide both an analytical and artistic context and offer a universal appeal for humanity to see the world more clearly. Just as mapping is an essential component in everyday life, underwater mapping is critical for many areas of science, including climate change models, deep-sea mining, and a deeper understanding of unique marine habitats.
Underwater mapping has been a key component of the 2022 E/V Nautilus expedition season, with three of the ten cruises focused on mapping. Despite its importance, mapping may seem “lackluster” compared to the vibrant images, breathtaking biodiversity, and excitement of new discoveries inherent in cruises utilizing remote operated vehicles (ROVs) like Argus and Hercules. But before our scientists can operate ROVs in the water, they require high-resolution maps to better understand the complex topography of a potential dive site.
So, let’s increase our knowledge of hydrography with these five fun facts about mapping!
Mapping Fact Number 1: Only 23% of the Seafloor is Mapped in High Resolution
The ocean is a busy place and only getting busier as humans develop technologies that can reach deeper waters. Climate change models, offshore mining, and deep-sea exploration require quality, high-resolution maps. Even so, most of the world's deep ocean remains unmapped, leaving gaps in knowledge necessary for safe operations and potential conservation measures. In 2022, the General Bathymetric Chart of the Oceans (GEBCO) reports that only 23.4% of the seafloor has been mapped in high resolution, based on their GEBCO 2022 grid. Each year the number goes up slightly based on the work of many organizations, including OET. GEBCO aims to provide the most authoritative publicly available bathymetry of the world's oceans. However, the grid and the archives it is based on, known as IHO Data Centre for Digital Bathymetry, still does not contain all of the existing high-resolution data. Currently, no single database does, and possibly no database ever will.
Nautilus and vehicles worldwide are working on mapping the entire seafloor by 2030 as part of a global mapping effort called GEBCO-Nippon Foundation's Seabed 2030, U.S. President Biden's executive order on tackling climate change, and the United Nations' Decade of Ocean Science and Sustainable Development. The goal is to combine scientific resources, expertise, and technological advancements to map approximately 3 billion acres of U.S. underwater territory.
Although less than one-quarter of the deep ocean has been mapped in high resolution, an estimate of the seafloor bathymetry does exist. Satellites equipped with altimetry sensors can detect gravity anomalies on the sea surface. The altimeters in the satellites measure the height of bulges of water over areas to provide a basic image of what lies beneath the waves. While this gives a preliminary idea of the seafloor's shape, these estimates may lack greater details and have large errors. For example, in 2005, the USS San Francisco struck a small seamount that was not reflected in the available altimetric data.
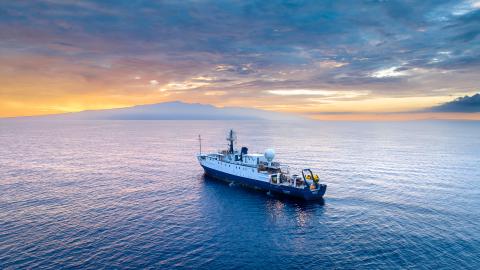
A high-resolution multibeam sonar system, such as the Kongsberg EM302 mounted on the Nautilus hull, provides a clear, detailed picture of the seafloor. Since 2013, Nautilus has mapped over 700,000 square kilometers (270,000 square miles) of seafloor in the Atlantic (including the Caribbean and the Gulf of Mexico) and Pacific. That is enough to have mapped Iceland seven times!
Mapping Fact Number 2: Sound is Used to Create Maps
Through echolocation, whales and bats use sound to “see” the world. They emit a burst of acoustic noise and listen for it to “bounce” back. The time it takes for sound to return allows these animals to create a mental image. In the same vein as echolocation, mapping employs sound to create high-resolution seafloor maps.
Mounted on the bottom of Nautilus is a Kongsberg 30 kHz EM302 multibeam echosounder that can produce state-of-the-art deep-sea maps. The Kongsberg transducer emits 432 acoustic beams per swath, and in most water depths, two swaths per cycle; each of those cycles are individually known as a “ping.” After a beam strikes the seafloor, it bounces back to the ship, where a receiver listens for its return. An individual ping can reach depths between 100 and 7,000 meters (330 to 23,000 feet). Advanced computers aboard the ship compute the time taken for each beam to return, calculating where the sound bounced back from — the longer sound needs to return signifies a further range from the ship and a deeper depth. The way the ship moves, also known as the roll, pitch, and heave, can also influence the data — all factors considered when mapping the seafloor.
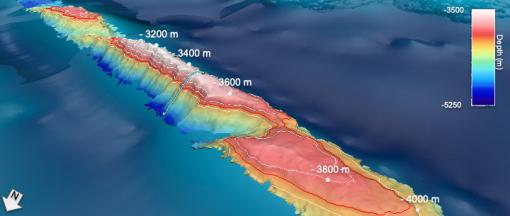
A single acoustic beam pulse provides a swath of seafloor as wide as 8,000 meters (26,200 feet). To create a complete seafloor map, Nautilus traverses the sea in a back-and-forth lawnmower pattern traveling between 8 and 12 knots as the ship “mows the lawn". The topographical maps that the multibeam produces provide images of shipwrecks and hydrothermal vents, along with traditional seafloor features such as seamounts and trenches.
Mapping Fact Number 3: Mapping Can Help to Determine the Type of Seafloor
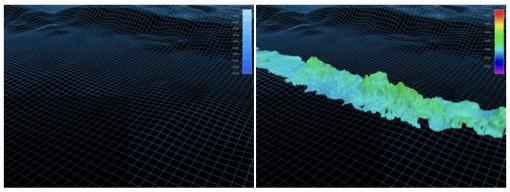
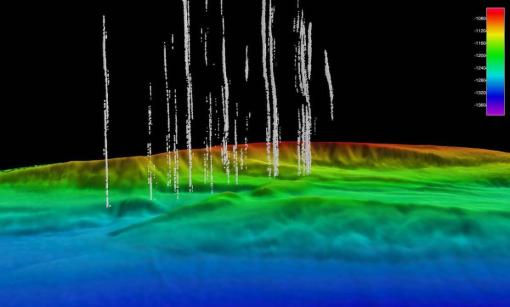
In addition to sound providing the depth of the ocean floor, it can also give us clues as to the characteristics of the seafloor. This may include hard rock, soft sand, or coral reef variations. Researchers listen not only to the time it takes for the “ping” to return to the ship but also to how loud the ping is when it returns. The strength of a returning ping is called backscatter. Areas of rugged seafloor, such as lava rock, will have a strong, more intense backscatter, while regions of softer seafloor, like mud, will have a softer or less intense backscatter. Astonishingly, water column backscatter can also detect plumes of bubbles rising from the seafloor that indicate methane gas seeps.
Backscatter measurements combined with a seafloor map allow for a better, more complete understanding of the seafloor.
Mapping Fact Number 4: Some Marine Animals Can Hear the Sonar Pings
Multibeam sonars used for mapping, such as the Kongsberg EM302 multibeam echosounder on Nautilus, typically use frequencies from 12 to 700 kilohertz (kHz). Marine mammals can hear between 5 hertz and 200 kHz. This means that lower frequencies — or “deeper sounds” — that are used in mapping can be heard by different marine mammals and possibly other marine animals. Scientists largely agree that the sounds marine organisms hear are likely not harmful.
As a preventative measure, when the mapping sonar is first turned on, the sound is kept very low and gradually increases to ensure that all protected species have time to leave the area. Nautilus slowly moves in its lawnmower pattern between 7 and 10 knots. A humpback whale, by contrast, typically swims between around 14 knots — and as fast as 26 knots! This provides large marine mammals like whales ample time to move away from the sonar. Additionally, a crew member is always standing watch to spot any protected animals such as whales or sea turtles that come into view. If one of these endangered species approaches the ship within 100 yards, our science team immediately halts ship motion. If the sonar is on, it is left on to avoid what is called a “startle response.”
Mapping Fact Number 5: Some New Vessels Are Uncrewed or Autonomous
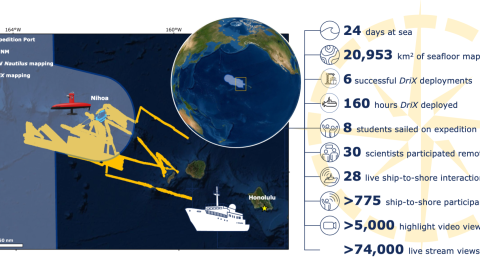
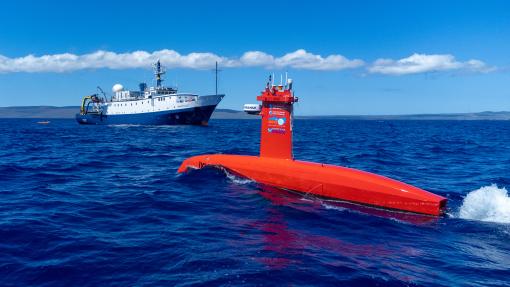
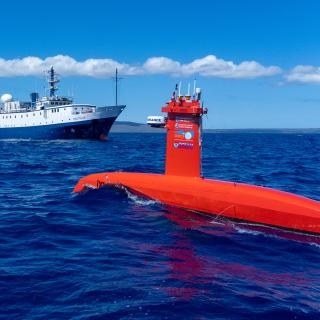
Some new mapping vehicles like DriX are uncrewed, meaning they can operate without a team of humans – though humans still monitor them. Other vehicles, like AUVs (autonomous underwater vehicles), are autonomous, meaning they are programmed with a mission, deployed, and then more or less left to run their mission without human intervention. Mapping is an undisputed necessity for ocean exploration. However, it comes at a high price both in time and money, sending ships to every unmapped place on the planet. Expedition NA142 Lu’uaeaahikiikawawaapalaoa focuses on advancing technologies for the future of mapping utilizing the uncrewed surface vessel (USV) Drix in conjunction with Nautilus. This expedition continues efforts to understand the potential of uncrewed and autonomous systems to increase mapping efficiency.
When launched, DriX’s bright submarine-shaped body leaves its protective housing called the universal deployment system (UDS). It begins its mission to map the seafloor at shallower depths than our multibeam sonar typically operates, from nearly zero to 500 meters (1,640 feet), depending on which frequency is used. Like Hercules and Argus, a pilot and co-pilot typically control DriX from the control van aboard Nautilus. DriX is capable of mapping for up to seven consecutive days, during which time Nautilus can continue conducting mapping in deeper waters.
Learn more about the acoustic mapping technology aboard Nautilus by exploring these Ocean Exploration Trust education resources:
- Blog: Read the Rainbow: Seafloor Mapping Glossary
- Blog: More than just bathymetry
- Blog: What’s in a name? Defining Cartography and Hydrography
- STEAM Educational Module: Seafloor mapping simulation (available in English and Spanish)
- Mini-lesson: Painting Rainbows on the Seafloor
- Mapping to the Speed of Sound: How UCTD Instruments Inform Acoustic Mapping
About the Author
Katie Doyle is a science communicator and ocean educator. She teaches students of all ages using place-based education in the Gulf of Mexico. She utilizes her creativity to construct hands-on lessons explaining complex oceanographic topics.
Luʻuaeaahikiikawawāapalaoa: Dual-Technology Seafloor Mapping
This expedition focuses on high-resolution mapping areas of Papahānaumokuākea Marine National Monument (PMNM) currently lacking data using ship-based mapping surveys in deep waters as well as deploying the uncrewed surface vessel DriX for nearshore mapping.