What’s In a Name? Defining Cartography and Hydrography

Scientific terms can be a bit confusing, especially when they sound similar or are about similar topics. For example, in the category of words ending in “-graphy,” one can find: Geography (the study of spatial relationships on Earth’s surface), areography (the geography and features of Mars), and orography (the science of mountains). Cartography and hydrography are two such “graphies” that we often use in deep-sea exploration. Let’s dive in.
Cartography is the art of visually representing a geographical area, whereas the National Oceanic and Atmospheric Administration (NOAA) defines hydrography as “the science that measures and describes the physical features of bodies of water and the land areas adjacent to those bodies of water.” Let’s look at how each of these disciplines work together to contribute to better mapping and an understanding our world’s oceans.
Though maps can be made in a variety of ways, the process can be thought of in two phases:
- Collecting data: This is when the global positioning, or latitude and longitude, of the area to be mapped is established. (To learn more about global positioning and how it relates to latitude and longitude, check out this educational module). The data about the area is then collected, either from maps that already exist– or by surveying, which is directly taking measurements of the area.
- Visually representing the data: A map of the data is drawn using visual principles that promote informational clarity for a specific audience, or map user.
Cartography is associated with the visual representation phase. Though the term “cartography” is usually associated with land maps, it is involved in the creation of all maps, including those of the ocean and other water features.
So, if the final step of all mapmaking is cartography, where does hydrography fit into the mapping process? That’s where the conversation gets tricky. According to the NOAA definition, hydrography belongs in the data phase of map creation when the depths of the seafloor are measured and recorded. However, hydrographers often produce visual representations of their data.
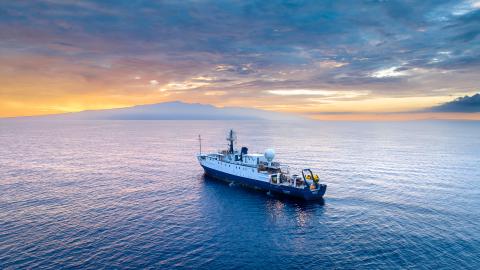
But do E/V Nautilus hydrographers, mapping experts that measure water depth, also consider themselves cartographers? A quick trip to the Nautilus data lab, where our on-ship mappers collect bathymetry and seafloor mapping data, resulted in a resounding, “No!”
Seafloor mapping experts Lindsay Gee and Hayley Drennon went on to describe the subtle differences in the connotations around “hydrography,” “cartography,”and “mapping.”
As mappers, Gee and Drennon most often consider themselves to be in the data collection phase of the mapping process. Gee noted that some hydrographers even use the designation “hydrographic surveyors,” to specify that they are surveying the seafloor, and not making finalized visual representations.
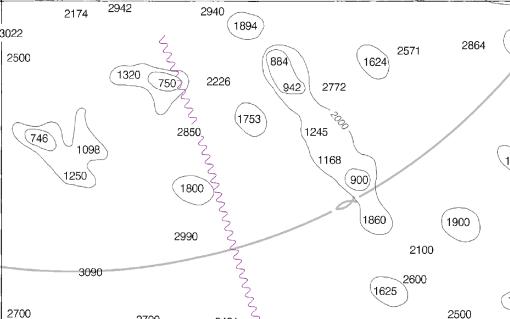
While surveyors do make preliminary maps of the data that they collect during mapping expeditions, these maps are generally not to be used for navigation until they are re-visualized by a cartographer. Preliminary maps from surveys contain all of the data collected, often without the labels and markings necessary to make the map safe for navigation. It’s the cartographer’s job to take the raw survey data, determine who the map is being made for (blind hikers, tourists, sailors, etc.) and guarantee the map gives its user the clearest information possible.
Nautilus expeditions, like those conducted near the remote Johnston Atoll or in transit between port destinations, often take the opportunity to gather high resolution data of the seafloor in order to provide scientists with a better understanding of the world’s oceans. This enables responsible decision-making regarding the management and maintenance of our planet. Nautilus is a participant in the Nippon Foundation-GEBCO Seabed 2030 project aiding in the effort to map 100% of Earth’s seafloor at a high resolution by the end of the decade.
To fulfill this mission, hydrographers and cartographers work together to create accurate maps that ensure the best information is available for use, especially for expeditions like those conducted aboard Nautilus.
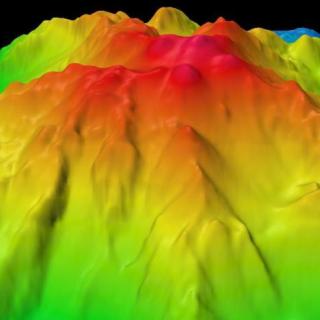
We like to remember this general rule of thumb when it comes to these two deep-sea “-graphies” — hydrography relates to the collection of seafloor data that leads to the creation of our bathymetric maps via cartography.
Want to learn more about seafloor mapping? The Ocean Exploration Trust has a variety of learning modules and resources for classrooms, including the following:
- Seafloor Mapping Classroom Warm Up
- Seafloor Mapping Educator
- Seafloor Mapping Overview (Teaching Animation)
- Read the Rainbow: Seafloor Mapping Glossary
- More than Just Bathymetry: Seafloor Mapping as a Tool for Exploration
About the Author
Abrian Curington is a visual storyteller and cartographer, with a BA in Fine Art from Western Washington University and a Capstone Certificate in GIS Fundamentals from University of Wisconsin—Madison. She is dedicated to producing engaging graphic novels, illustrated prose and maps that ignite curiosity, and champion fun and adventure. She serves as a Science Communication Fellow aboard E/V Nautilus. Find her work at her website Blue Cat Co. or on social media @AbrianCArt.
Johnston Atoll Mapping
This 24-day expedition will involve multibeam and sub-bottom profiler mapping to reveal the seafloor within the Johnston Atoll Unit of Pacific Remote Island Marine National Monument (PRIMNM). Johnston Atoll, one of the most isolated atolls globally, is located in the central Pacific Ocean, between the Hawaiian Islands and the Line Islands. The main objective of this expedition will be to collect high-resolution seafloor bathymetry data where it has not been previously collected.