More than Just Bathymetry: Seafloor Mapping as a Tool for Exploration

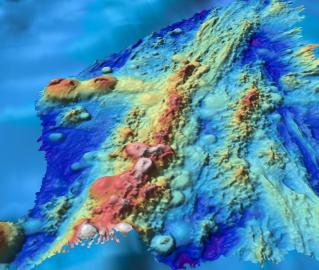
When our vehicles are out of the water, you may notice our live feeds are dominated by a beautiful multicolored image. You might hear our explorers say things like “mowing the lawn” and “pinging the seafloor.” What you are watching is our multibeam sonar mapping system at work, and this system is one of the most important tools we have for ocean exploration. Before the ROVs are sent down to the seafloor, our scientists map the area first to get a sense of whether the seafloor below is flat or mountainous, muddy or rocky, chasmed or ridged. Our dives are efficient and full of exciting discoveries because the team is able to pick out investigation 'targets' from a multibeam map of the seafloor. Installed on the ship in the offseason between exploration season 2012 and 2013, the Kongsberg EM302 multibeam sonar allows E/V Nautilus to produce state-of-the-art maps in remote regions of the world where no one has ever mapped before.
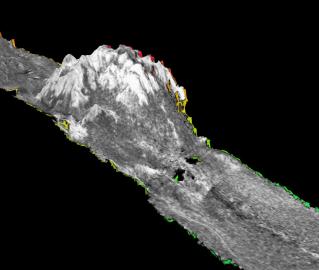
The multibeam sonar consists of two large arrays mounted at right angles to one another on the bottom of the ship that are ten and eleven feet long. You can see them below in the T-shaped outline. One array emits pulses of sound while the other listens for those sound to return.
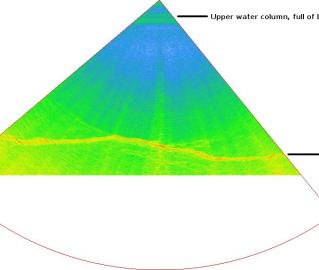
While Nautilus is cruising, the transducer emits two powerful sonar pulses of sound (or “pings”) that travel to the seafloor. Once the pulses bounce off the seafloor, they travel back up to the receiving array. The system collects all this data while the ship is moving ahead at eight to ten knots. The distance to the seafloor can be determined from the travel time (measured by the sonar) and the speed of sound through water (measured with separate sensors).
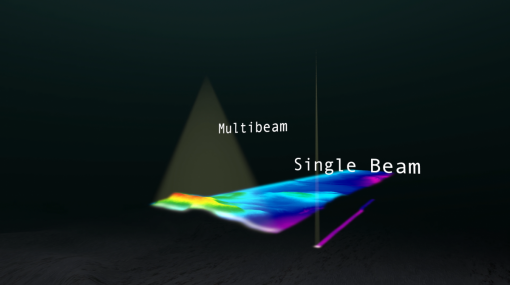
What makes this sonar system different from early mapping systems is that instead of emitting a single beam of sound to the seafloor, which returns only one sounding (e.g. one depth measurement per ping), the multibeam sonar emits two fans of beams, perpendicular to the ship. This results in up to 864 soundings per ping, spread across a distance or “swath width” that ranges from two to five times the water depth.
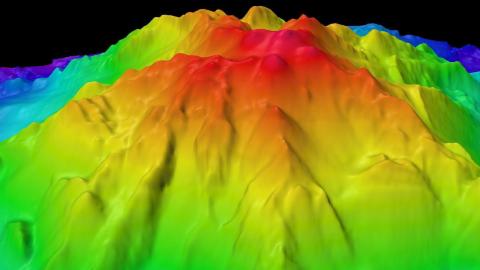
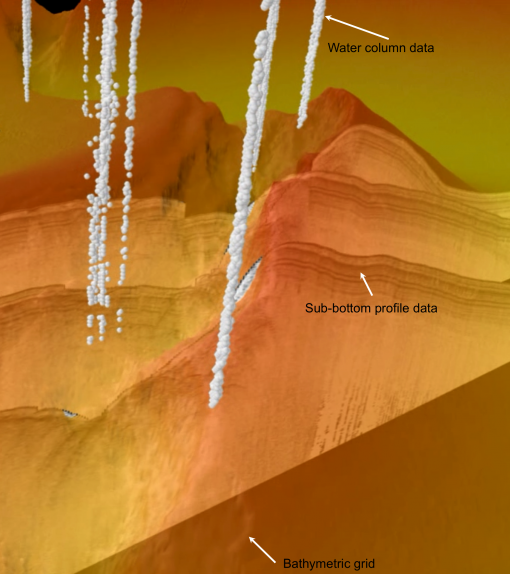
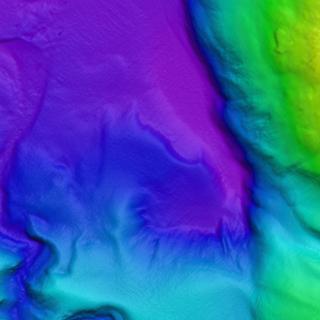
Through a series of precise attitude sensors, which measure the ship’s motion (heave, pitch, roll, and yaw), the return signals are divided into boxes (or grid cells), where each box has a single depth sounding. By doing this, each pulse provides a strip of depth measurements (soundings). Using GPS information, these individual strips are combined to form a surface or “digital elevation model” (DEM) of ocean bathymetry. The multibeam sonar can map large areas of the seafloor much more efficiently and accurately than other mapping technologies.
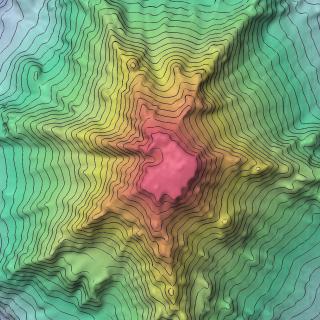
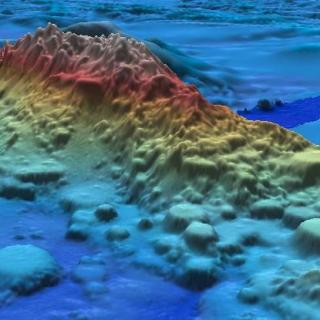
Why is the sonar system used? Explorers want to gather as much information as they can to make an informed decision about where to dive with the ROVs, to increase the opportunities to make discoveries. Whether we are exploring seamounts, canyons, or even a shipwreck, making a map of the seafloor is helpful so the ROVs don’t spend all of their time crawling over the mud before encountering a target. In order to locate interesting terrain, scientists carefully examine the preliminary mapping data for features, such as rock cliffs or ridges, which are preferred habitat for many organisms.
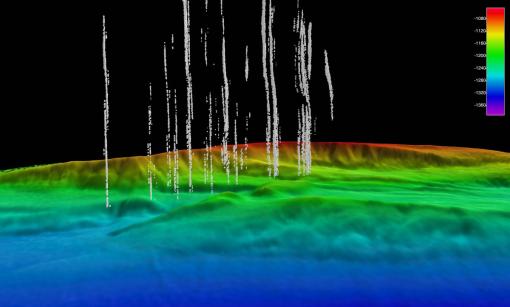
In addition to detecting seafloor features, the multibeam can be used to detect phenomena in the water column. For example, when mapping the Cascadia Margin, scientists were able to detect plumes of bubbles emanating from the seafloor, indicating that there were gas seeps in the area. Sound waves reflect strongly off the gas bubbles and are visible in the water column data.
From 2013 - 2016, the Corps of Exploration mapped over 250,000 km2 (or more than 80 Rhode Islands) of seafloor in the Atlantic, Gulf of Mexico, Caribbean Sea, and Eastern Pacific Ocean. Some of these places had never been mapped before, such as parts of the Mesoamerican Reef, the Anegada Passage, and US territories, including parts of National Marine Sanctuaries. The data collected with the multibeam is valuable for many reasons including understanding connections between seafloor type and biological communities, identifying hydrocarbon vents, and locating, quantifying, and protecting valuable habitat and resources. Only 11% of the global ocean has been mapped in high-resolution like the Nautilus is capable of surveying. With so much of the seafloor left to explore, who knows that this sonar system will discover next.
California Mapping
This expedition will continue previous years of mapping by Nautilus to provide the foundational seafloor mapping data set of a number of priority sites of Greater Farallones National Marine Sanctuary (GFNMS) and Cordell Bank National Marine Sanctuary (CBNMS). GFNMS protects 3,295 square miles, and the CBNMS encompasses 1,286 square miles of seafloor habitat, and achieving a better understanding of habitats in these regions helps to inform conservation and management.
Pacific Seamounts
This mapping expedition will focus on unmapped areas of the Pacific between San Francisco and Honolulu as E/V Nautilus operations move out into the Pacific Ocean between the Hawaiian Islands and Samoa. The transit route will utilize the multibeam echosounder and sub-bottom profiler to fill in gaps in seabed mapping coverage across the Pacific, plus targeted mapping of a number of seamounts in the vicinity of the Murray Fracture zone.
Pacific Seamounts
The expedition will focus on mapping from Honolulu to San Francisco, as the E/V Nautilus’ operations move back east to the US West Coast, in addition to the first deep water test of a new mobile ROV system. The mapping route has been planned to utilize the multibeam echosounder and sub-bottom profiler to fill in gaps in seabed mapping coverage across the Pacific.
Mapping the California Borderland
For the final leg of the 2016 expedition, Nautilus will work along the California Borderland region offshore San Diego to San Francisco. In this complex margin within America’s Exclusive Economic Zone, few areas of the seafloor have been extensively mapped. E/V Nautilus will utilize its hull-mounted multibeam echosounder to survey these zones and create maps to show the acoustically-derived bathymetry of the seafloor.